![]()
|
WATSON-WYATT HAS DOCUMENTED THE
RELATION BETWEEN HOW COMPANIES MANAGE TALENT AND SHAREHOLDER VALUE. The enclosed report comes
to us from Watson Wyatt (www.watsonwyatt.com). BOARD OPTIONS, INC. Boston, MA “Helping Companies Manage
the Senior Executive Assignment CycleÔ Can the way a company
manages its human capital significantly affect its financial performance? Yet a crucial question
remained: Do better people management strategies actually create higher
market value? Or do financially successful companies simply have more
resources to allocate to human capital initiatives? We now have powerful
insight into the answer. Our second Human Capital Index study allowed us to
compare one set of companies at two points in time to analyze the
correlation. The results are in and they are dramatic. Superior human capital
practices are not only correlated with financial returns they are, in fact, a
leading indicator of increased shareholder value. Further, we found that
superior HR management leads financial performance to a much greater extent
than financial outcomes lead good HR. We were also able to identify certain
HR practices as value drivers and throw a cautionary flag in front of some
conventional practices actually associated with a decrease in financial
performance. The results of this study
are more meaningful now than ever before. While the state of the economy is
largely uncertain, demographic trends are not. There is no doubt that the
labor shortage will continue well into the next decade and that superior HR
practices are a key to attraction, retention and more and more, business
outcomes. It is also a certainty that executives will now, more than ever,
look to HR to justify expenditures and demonstrate the economic value of an
organization’s people practices. The overriding message:
If a company’s goal is to improve shareholder value, a key priority must be
its approach to human capital. In the first HCI study,
conducted in 1999, Watson Wyatt surveyed more than 400 U.S. and Canada-based
companies that were publicly traded, had at least three years of shareholder
returns, and a minimum of $100 million in revenue or market value. We asked a
wide range of questions about how the organizations carried out their human
resources practices, including pay, people development, communications and
staffing. Responses were matched to
objective financial measures, including market value, three- and five-year
total returns to shareholders (TRS), and Tobin’s Q, an economist’s ratio that
measures an organization’s ability to create value beyond its physical
assets. Publicly available data from Standard and Poor’s Compustat database
were used to access the financial information needed. To investigate the
relationship between human capital practices and value creation, a series of
multiple regression analyses were conducted, identifying a clear relationship
between the effectiveness of a company’s human capital practices and
shareholder value creation. Thirty key HR practices were associated with a 30
percent increase in market value. Summary HCI scores were created for
individual organizations so that results could be expressed on a scale of 0
to 100. An HCI score of 0 represents the poorest human capital management,
while a score of 100 is ideal. In 2000, a European HCI
survey was conducted to gain a more global perspective on these issues. More
than 250 responses from 16 countries were received. The survey included 200
questions in six languages and covered companies of all sizes and from all
sectors of the economy — more than a third of participants were in the Euro
500 and more than a quarter were in the Global 500. The findings from the
European study were similar to the North American results, with improvements
in 19 key HR practices associated with a 26 percent increase in market value.
In early 2001, the HCI
research was conducted again, this time including responses from more than
500 North American companies. In this most recent research, the participants
reflected a broader view of business and included some larger, more prominent
firms — with average annual sales of $4.68 billion, $8.45 billion in market
value and 18,697 employees on average. Fifty-one of these companies
participated in both the 1999 and 2001 surveys. The European and new
North American data were then merged. The result is a complete respondent
base of more than 750 companies in the United States, Canada and Europe with
at least three years of shareholder returns, 1,000 or more employees and a
minimum of $100 million in revenues or market value. Results Link Superior
Human Capital Practices to Higher Shareholder Return The results from the 2001
HCI study are just as definitive as those from 1999: The higher a company’s HCI
score, the higher its shareholder value. In other words, the better an
organization is doing in managing its human capital, the better its returns
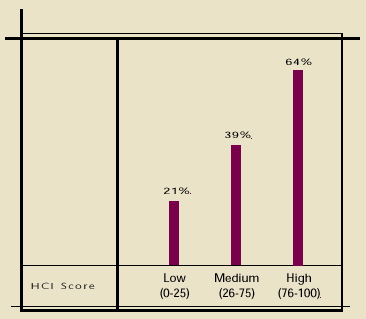
for shareholders. We broke the companies into three groups based on their
summary HCI scores. Those in the low group averaged a 21 percent five-year
return. The medium group averaged 39 percent. Those with high HCI scores
returned 64 percent over five years (Figure 1). Figure 1: Five-Year Total Returns to
Shareholders In addition to providing
dramatic evidence that good human capital management matters, the HCI study
shows precisely which HR practices — amid the ever-increasing portfolio of
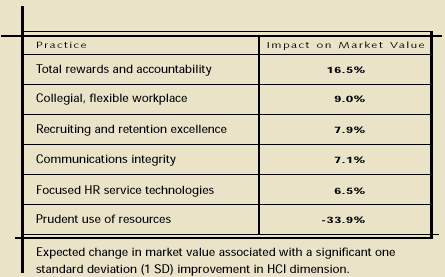
options — have an impact on the bottom line. This year’s study identifies the
49 specific HR practices that play the greatest role in creating shareholder
value. We have divided those practices into six dimensions (Figure 2). The
research quantifies exactly how much an improvement in each practice could be
expected to increase a company’s market value. For example, a company that
makes a significant improvement * in all of the practices categorized under
“Total Rewards and Accountability” should see its value improve by 16.5
percent (Figure 2). And a significant improvement in 43 key HR practices is
associated with an increase of 47 percent in market value. Additionally, one
dimension, "Prudent Use of Resources" indentifies six practices
that diminish shareholder value. Figure 2: Key Links Between Human Capital * What constitutes a
“significant improvement”? A one standard deviation increase. Most answers to
HCI questions are on a 1 – 5 scale, so a significant change is a
one-scale-point movement from a 1 to a 2, a 2 to a 3, and so on. The first HCI study
confirmed that there was a positive relationship between the quality of a
company’s HR practices and its economic results. But it did not offer
resolution to the debate that has raged for years: Do effective HR practices
drive positive financial results or do positive financial results lead to
better HR practices? Two years ago, we noted
that the best performing companies did not simply have better-funded
programs, they had entirely different programs than the poorly performing
companies. The high performers employed certain programs (e.g., broad-based
stock options) that low performers did not. They stayed away from certain
programs (e.g., training employees for future jobs) that low performers
embraced. If it were true that good financial performance simply afforded
rich companies the ability to implement elaborate HR programs, one would
expect to see the same types of programs across the board. We did not. Yet it
was still not proof that superior HR management was causing high market
value. The best we could offer at the time was that the relationship probably
moved both ways. But our latest study
yields the missing crucial data. Fifty-one companies participated in both the
original and the follow-up HCI studies. We have HCI scores and financial
performance information for 1999 and 2001. To see which way the
relationship truly runs, we simply compared two different correlations:
If better financial
performance is what creates superior HR practices, Correlation B should be
larger. If, in fact, the way companies manage their human capital is what
drives financial success, Correlation A should be larger. Our results were
dramatic. Correlation A, .41, is statistically significantly larger than
Correlation B, .19. The cross-lag panel analysis demonstrates HR practices
are not only associated with business outcomes, but also create them. Moreover,
a careful inspection of all the data shows that for every available
correlation calculated over time, the relationship between past HR practices
and future financial performance is stronger than the relationship between
past financial outcomes and future HR practices. We will be following this
data prospectively in longitudinal studies, but for now the weight of the
evidence clearly favors human capital practices as a leading — rather than a
lagging — indicator of business success. Figure 3: Correlation Analysis There’s no question that
it pays to manage people right. Organizations have long
focused resources on other aspects of their companies, including
infrastructure, R&D, sales and advertising, just to name a few. These
things can increase shareholder value creation in measurable ways. Some — but
certainly not all — tried to use their human capital to increase returns to
shareholders. But even these companies were taking a shot in the dark,
because no one could quantify which human capital programs were linked to
good outcomes. The business case has
been building and Watson Wyatt’s Human Capital Index research makes it
airtight. The linkage between superior human capital management and superior
shareholder returns has been proven. Moreover, proof that superior HR
practices drive financial results more than superior financial results drive
HR practices supports our theory: If you hire the right people, create an
environment that supports creative thinking and increased productivity,
leveraged by technology, you’ll reap the rewards. |